Abstract
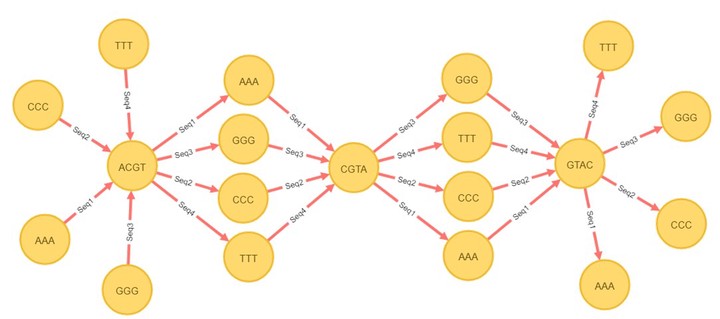
Since the Human Genome Project was completed in 2003, data scientists have developed algorithms in order to store and query high volumes of genomic data. The most common data storage techniques employed in these algorithms are flat files or relational databases. While sophisticated indexing techniques can accelerate queries, an alternative is to store biological sequence data directly in a way that supports efficient queries. Here we introduce a new algorithm that aims to compress the redundant information and improve the performance of query speed with the help of graphical databases, which have been commercially available since the mid-late 2000s. A graphical database stores information using nodes and relationships (edges). Our approach is to identify sub-sequences that are common among many sequences, and to store these as common nodes in the graph database. This is accomplished for sequencing data as follows; split the whole sequence into k-mers; if a given k-mer is common to enough sequences, then it is labeled as a common segment; if a k-mer is unique (or common to too few sequences), then it is labeled as a single segment. Thus, common nodes and single nodes are formed from common segments and single segments, respectively. These two kinds of nodes are connected by edges in the graphical database; this allows each original sequences to be reconstructed by following edges in the graph. This graphical database model allows for fast taxonomic queries of 16S rDNA. When queried, the database can first attempt to find common nodes that match the query sequence, and subsequently follow edges to single nodes to refine the search. This approach is analogous to that of compressive genomics, except that the compression is implicit in the graphical database storage model. Beyond simple sequence queries, this graphical database representation also supports variability analysis, which identifies highly variable vs. conserved regions of 16S sequence. Regions of low variability correspond to common nodes, while regions of high variability correspond to a variety of paths through single nodes. Benchmarking of sequence search indicates that query time in graphical databases is significantly faster than in flat files or relational databases. Implementation of graphical databases in genomic data analysis will allow for accelerated search, and may lend itself to other forms of efficient analysis, such as tetramer frequency analysis, which is useful in metagenomic binning.
Ahern, O. M., Stevick, R. J., Yuan, L., & Daniels, N. M. (2017). Analysis of 16S Genomic Data using Graphical Databases. In Proceedings of the 8th ACM International Conference on Bioinformatics, Computational Biology, and Health Informatics (pp. 599-599). ACM.